


Auto Ancillaries - A high growth manufacturing and consumer play


Introduction
We are witnessing strong demand revival of auto ancillaries (ancs) driven by not only domestic demand but from China+1 (export opportunity), and government mandate for localisation of content. This has sparked our interest in the sector, leading us to conduct a study of 13 auto ancillary companies representing a wide range of products and services.
Prior to delving deeper into auto ancillaries, a fundamental question arises: why pick auto ancs over OEMs (original equipment manufacturers like Maruti, Honda etc)? Particularly considering that the growth and profitability of auto ancillaries are intricately linked with OEMs? However, we found that over a 10-year horizon, auto ancillaries have outperformed OEMs by more than 4% annually, achieving an annualized return of 24% compared to 20% for OEMs. Therefore, our study of auto ancs is based on a its own merit too and not necessarily a proxy position or a contra call.
Note: Olectra Greentech has been excluded from our analysis due to its exclusive focus on the electric bus segment, which makes it less directly comparable to traditional auto companies.
Exhibit 1: Average stock return profile of Auto Ancs vs. OEM

Source: Screener.in and exchange data
Key drivers
China+1 and localization
Indian auto ancs are benefiting from China+1 sourcing of products by US and global auto majors. Given the low cost of manufacturing, government incentives & policies, auto ancs can provide value to global OEMs for a long time. Consequently, auto ancillaries are poised to capitalize not only on domestic growth but also from rising exports.
RACL recently won a contract to supply gears to ZF, the world’s largest gear manufacturer. This is an exemplary demonstration of the cost-effectiveness and quality prowess of an Indian auto ancillary. In addition, several other auto ancillaries have expanded their exports over the past 2-3 years.
Within India, the government’s directive to increase local content per vehicle which helps benefit entire value chain. This policy also encourages large international auto companies entering the Indian market to procure components from local suppliers.
Rising Value of Vehicle Content and Product Diversification
The trend towards premiumization, electrification, and vehicle light weighting is driving an increase in the value of content per vehicle. Simultaneously, many companies are expanding their product portfolios by introducing new offerings such as telematics, electric chargers, and motor control units.
Resulting Operating Leverage
The rise in content value and higher export volumes is enhancing margins across the industry. Even a modest improvement in revenue is generating a significant impact on Profit After Tax (PAT). The 13 companies covered in our study are likely to grow revenues by 17% over the next three years, while earnings growth will exceed 20%.
Study overview
Our analysis encompassed 13 auto ancillary companies specializing in a diverse range of products including metal sheets, aluminum castings, gears, lighting, TFT displays & clusters, aesthetics, smart locks, plastic moulds, chassis, switches, and alloy wheels.
Market cap distribution
We examined a mix of companies, comprising 3 mid to large caps with market capitalizations exceeding ₹30,000 crores, alongside smaller caps ranging from ₹1,000 to ₹7,000 crores in market cap.
Ranking and Assessment Criteria
Our evaluation criteria were predominantly structured around earnings growth (50%) franchise strength (40%) and less on valuation considerations (10%). Franchise strength included gross margins (15%), asset turnover (10%), capital efficiency (5% each for 3 sub-factors), and financial leverage (10%).
Story in charts
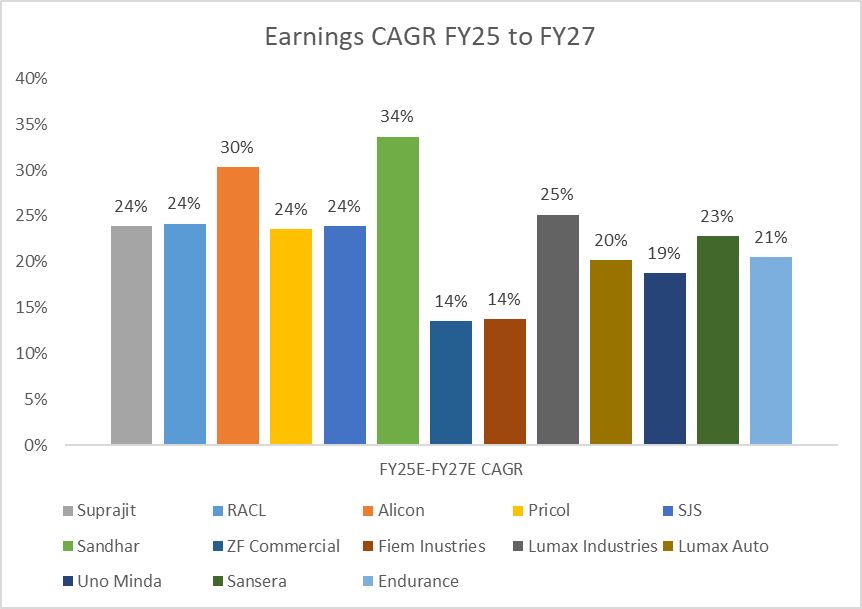
Earnings growth – Sandhar due to operating leverage is likely to lead earnings growth at over 30%
SJS has highest gross margins closely followed by RACL and Suprajit

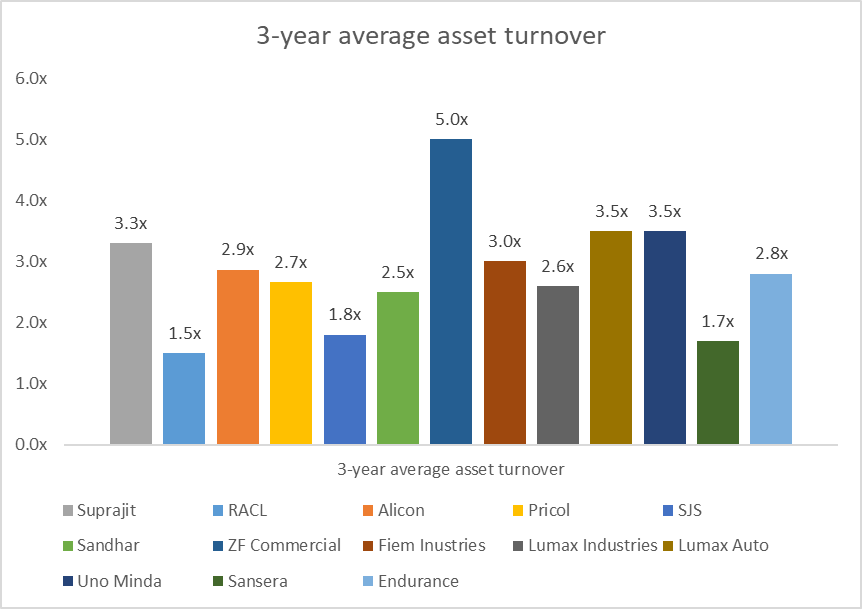
ZF commercial exhibits highest asset turnover followed at distance by Lumax auto and Uno Minda
Fiem Industries, SJS and Pricol have good ROCEs of 20% and above

ROE of RACL is highest owing to higher leverage on its balance sheet. SJS with negligible debt is able to have a relatively high ROE of 17%
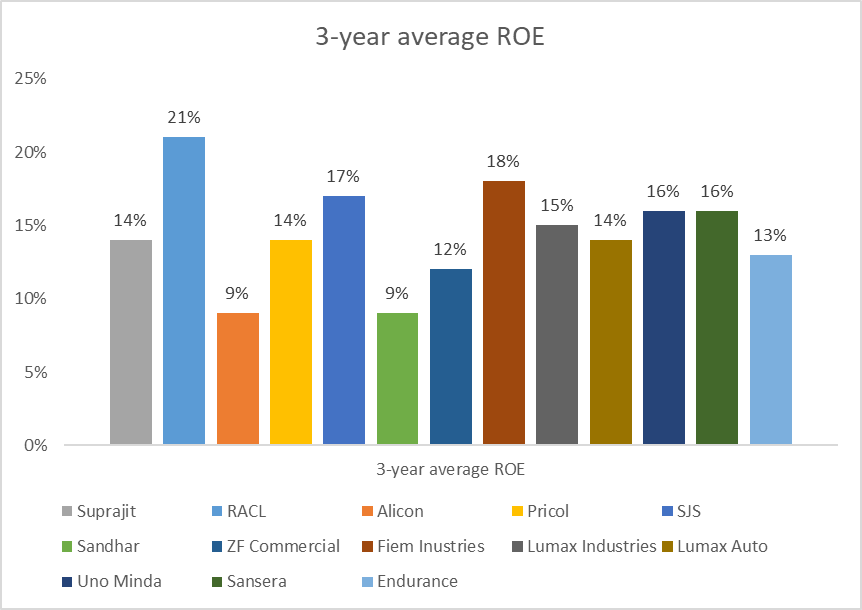
RACL has highest debt on its book with debt to equity ratio of 1.4x vs. average of 0.5x as of FY24

Outcome of study
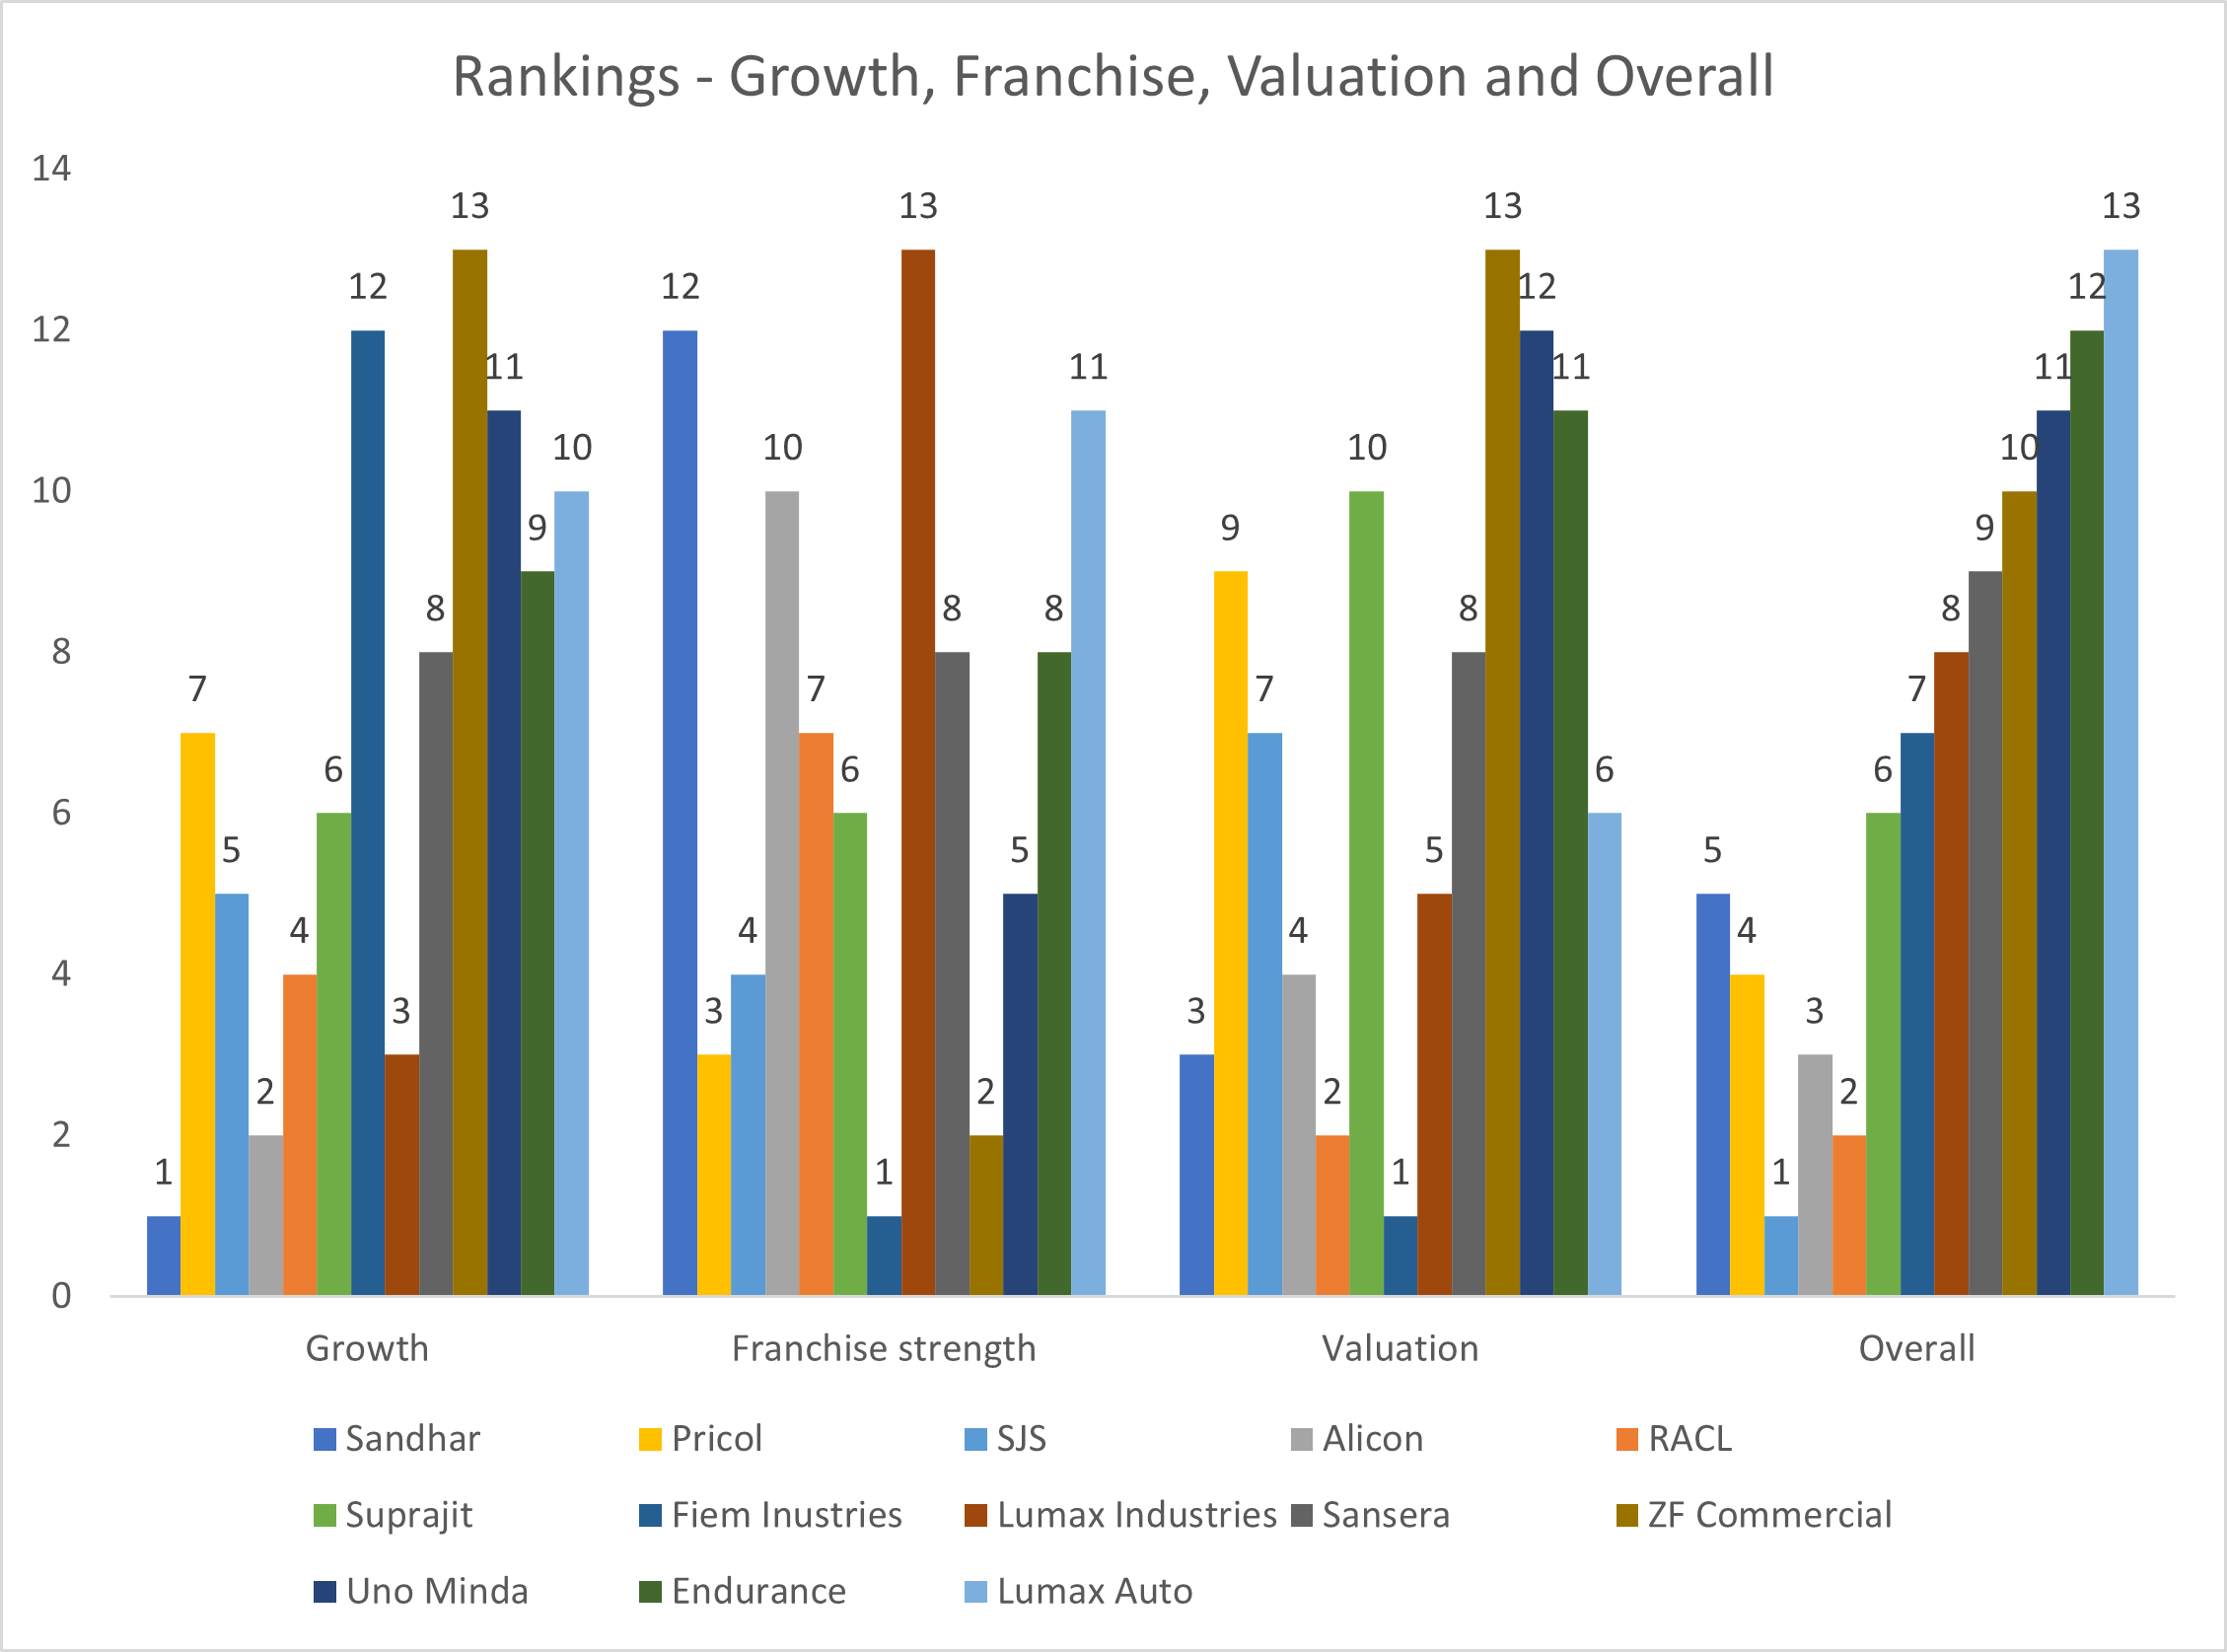
Among the 13 companies analyzed (Exhibit 2), SJS Enterprise achieved the top ranking due to its robust fundamental score driven by promising growth prospects and strong franchise score reflected in its high gross margins and efficient capital utilization. Despite being ranked 7th in terms of valuation, the high weightage assigned to growth (50%) and franchise strength (40%) outweighed the valuation factor.
It should be noted that companies ranking low does not necessarily mean bad companies. The rank is reflective of our preference of growth at highest level. For example Fiem Industries ranks best on valuation and return metrics, however, our higher weightage on growth and gross margins ranks Fiem overall in mid-level rankings. Hence, anyone who prefers valuations can rank Fiem much higher.
Exhibit 2: Summary for fundamental and valuation rankings along with final overall rankings
Source: Korman Capital workings and estimates
Conclusion: We believe that auto ancs provide industry growth plus exposure owing to export opportunity and reasonable valuations. Hence, select auto ancs can be good portfolio bets.
Disclaimer:
This update has been prepared by Investment Adviser and is solely for information of the recipient only. The update must not be used as a singular basis of any investment decision. The views herein are of a general nature and do not consider the risk appetite or the particular circumstances of an individual investor; readers are requested to take professional advice before investing. Nothing in this document should be construed as investment advice.
Each recipient of this document should make such investigations as they deem necessary to arrive at an independent evaluation of an investment in securities of the companies referred to in this document (including merits and risks) and should consult their own advisors to determine merits and risks of such investment.
The information and opinions contained herein have been compiled or arrived at, based upon information obtained in good faith from sources believed to be reliable. Such information has not been independently verified and no guaranty, representation of warranty, express or implied, is made as to its accuracy, completeness or correctness. All such information and opinions are subject to change without notice. Descriptions of any company or companies or their securities mentioned herein are not intended to be complete. Investment Adviser is not obliged to update this update for such changes. Investment Adviser has the right to make changes and modifications at any time.
This update is not directed to, or intended for display, downloading, printing, reproducing or for distribution to or use by, any person or entity who is a citizen or resident or located in any locality, state, country or other jurisdiction where such distribution, publication, reproduction, availability or use would be contrary to law or regulation or what would subject Investment Adviser or its affiliates to any registration or licensing requirement within such jurisdiction. If this update is inadvertently sent or has reached any person in such country, especially, United States of America, the same should be ignored and brought to the attention of the sender. This document may not be reproduced, distributed or published in whole or in part, directly or indirectly, for any purposes or in any manner.
It should not be considered to be taken as an offer to sell or a solicitation to buy any security. This document is not, and should not, be construed as an offer or solicitation of an offer, to buy or sell any securities or other financial instruments. This update should not be construed as an invitation or solicitation to do business with Investment Adviser. Investment Adviser do not take any responsibility, financial or otherwise, of the losses or the damages sustained due to the investments made or any action taken on basis of this update.
 | A guest post by
|
Any rationale on how the weights have been derived?
"Our evaluation criteria were predominantly structured around earnings growth (50%) franchise strength (40%) and less on valuation considerations (10%). Franchise strength included gross margins (15%), asset turnover (10%), capital efficiency (5% each for 3 sub-factors), and financial leverage (10%)"
why samvardhana motherson group is kept out of this discussion? Any particular reason behind this?